AI behind everything we deliver. Always, from now on.
Six slides on how AWP Labs reviews Primavera P6 schedules from the portfolio down to the activity: on the raw P6 database, nothing added and nothing changed, with AI behind the build and nothing behind your data.
 AWP Labs
What represents us
AI behind everything we deliver. Always, from now on.
AWP Labs develops its dashboards, schedule audits and toolchains with AI as a full member of the team. Planning expertise sets the rules. AI builds, tests and documents, every day, on the structure of the data, never on your data.
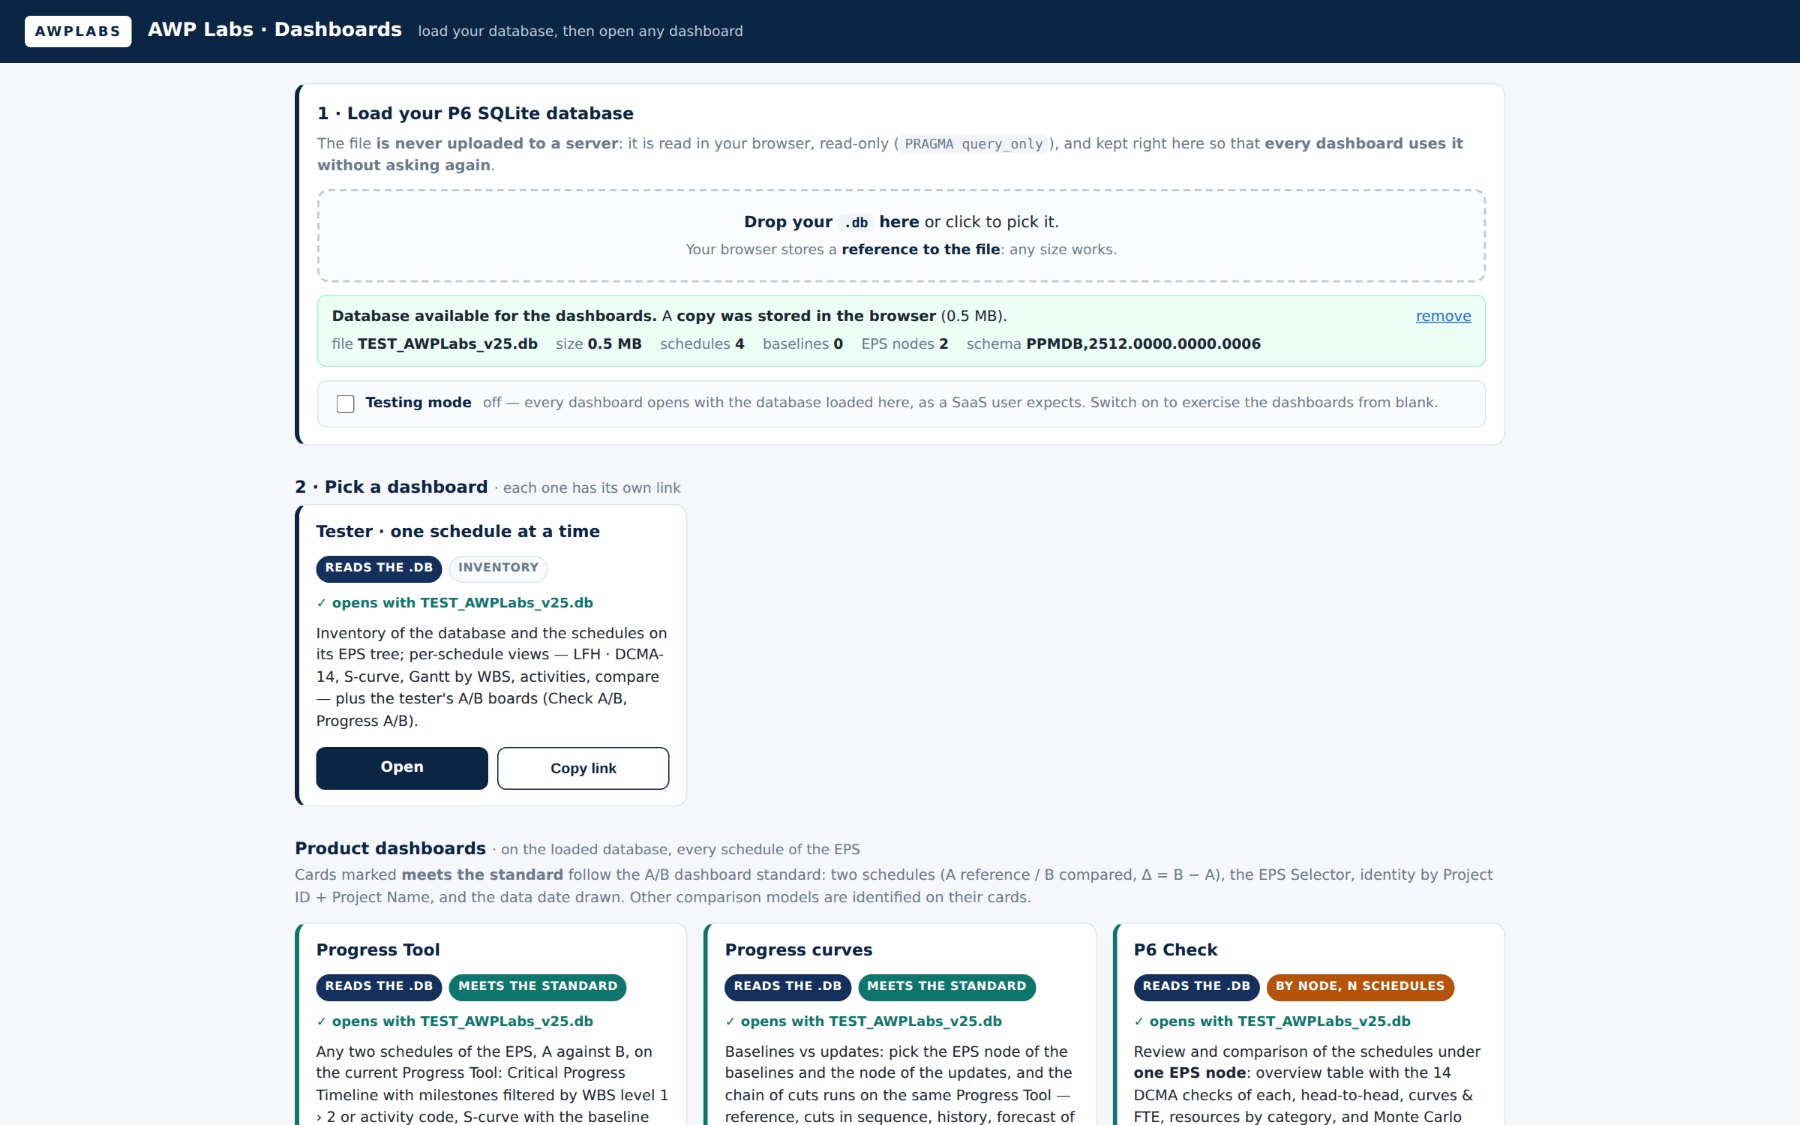 Nine dashboards on one P6 database, all built this way.
Build
Every dashboard, query and script is developed with AI in the loop on the P6 data model: tables, fields and synthetic databases. From request to published board in days.
Verify
Each board passes an automated browser regression before it ships: zero page errors, every control exercised on a synthetic P6 database.
Standardise
One A/B standard, one EPS selector, one code per object. AI applies the rules to every board, so nothing drifts between deliverables.
Remember
Every session, decision and gotcha goes to the toolchain memory. The knowledge stays with the service, not in one person's head.
180catalogued objects
37dashboard compositions
9dashboards on one .db
AI sees the structure of the data. Your data stays safe.
Development runs on the P6 schema and on synthetic or anonymised databases: client schedules never reach an AI. And the dashboards themselves run locally, with no AI, no internet and no server touching your data.
AWP Labs
Schedule review, from the portfolio to the activity
The schedule as P6 saved it. Nothing added, nothing changed.
AWP Labs dashboards read the P6 database itself. No export, no spreadsheet, no re-keying: every number on screen is the raw record of the program.
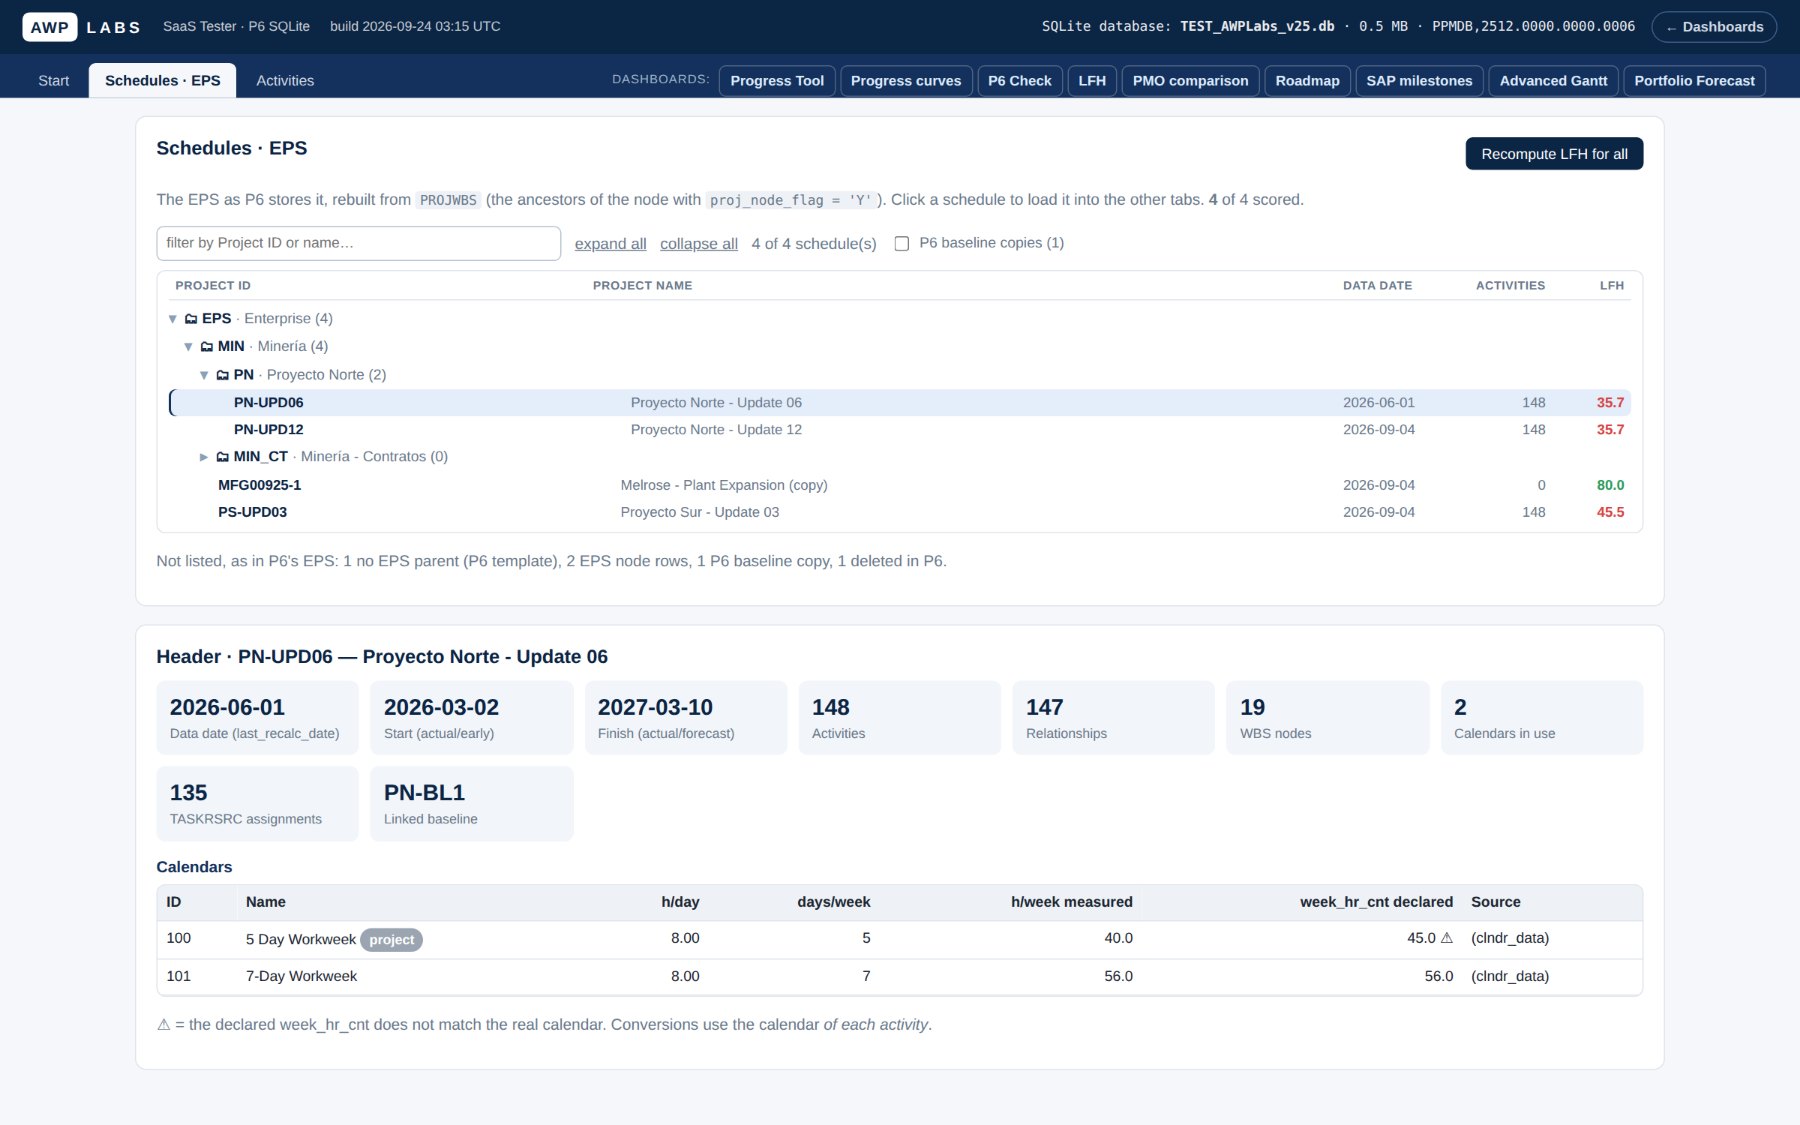 The EPS as P6 stores it, read from the database in the browser.
Raw P6 data
Reads the P6 SQLite snapshot directly. No XER, no intermediate files.
No manipulation
Read-only. No CPM recalculation, no writes back to P6, no edited values.
Local, disconnected
The dashboards run in your browser with no AI, no internet and no server behind them.
AWP Labs
01
Portfolio: every schedule in the EPS, scored from its own record.
The EPS as P6 stores it
Rebuilt from the PROJWBS table, not from a list someone typed. Baseline copies, templates and deleted projects are reported, not hidden.
One line per schedule: data date, activities, health
The LFH score (DCMA-14) sits next to each program, so the review starts where the risk is.
Portfolio matrix: all checks, all programs
The 14 checks side by side across the portfolio, exportable, with the same numbers the audit tab shows.
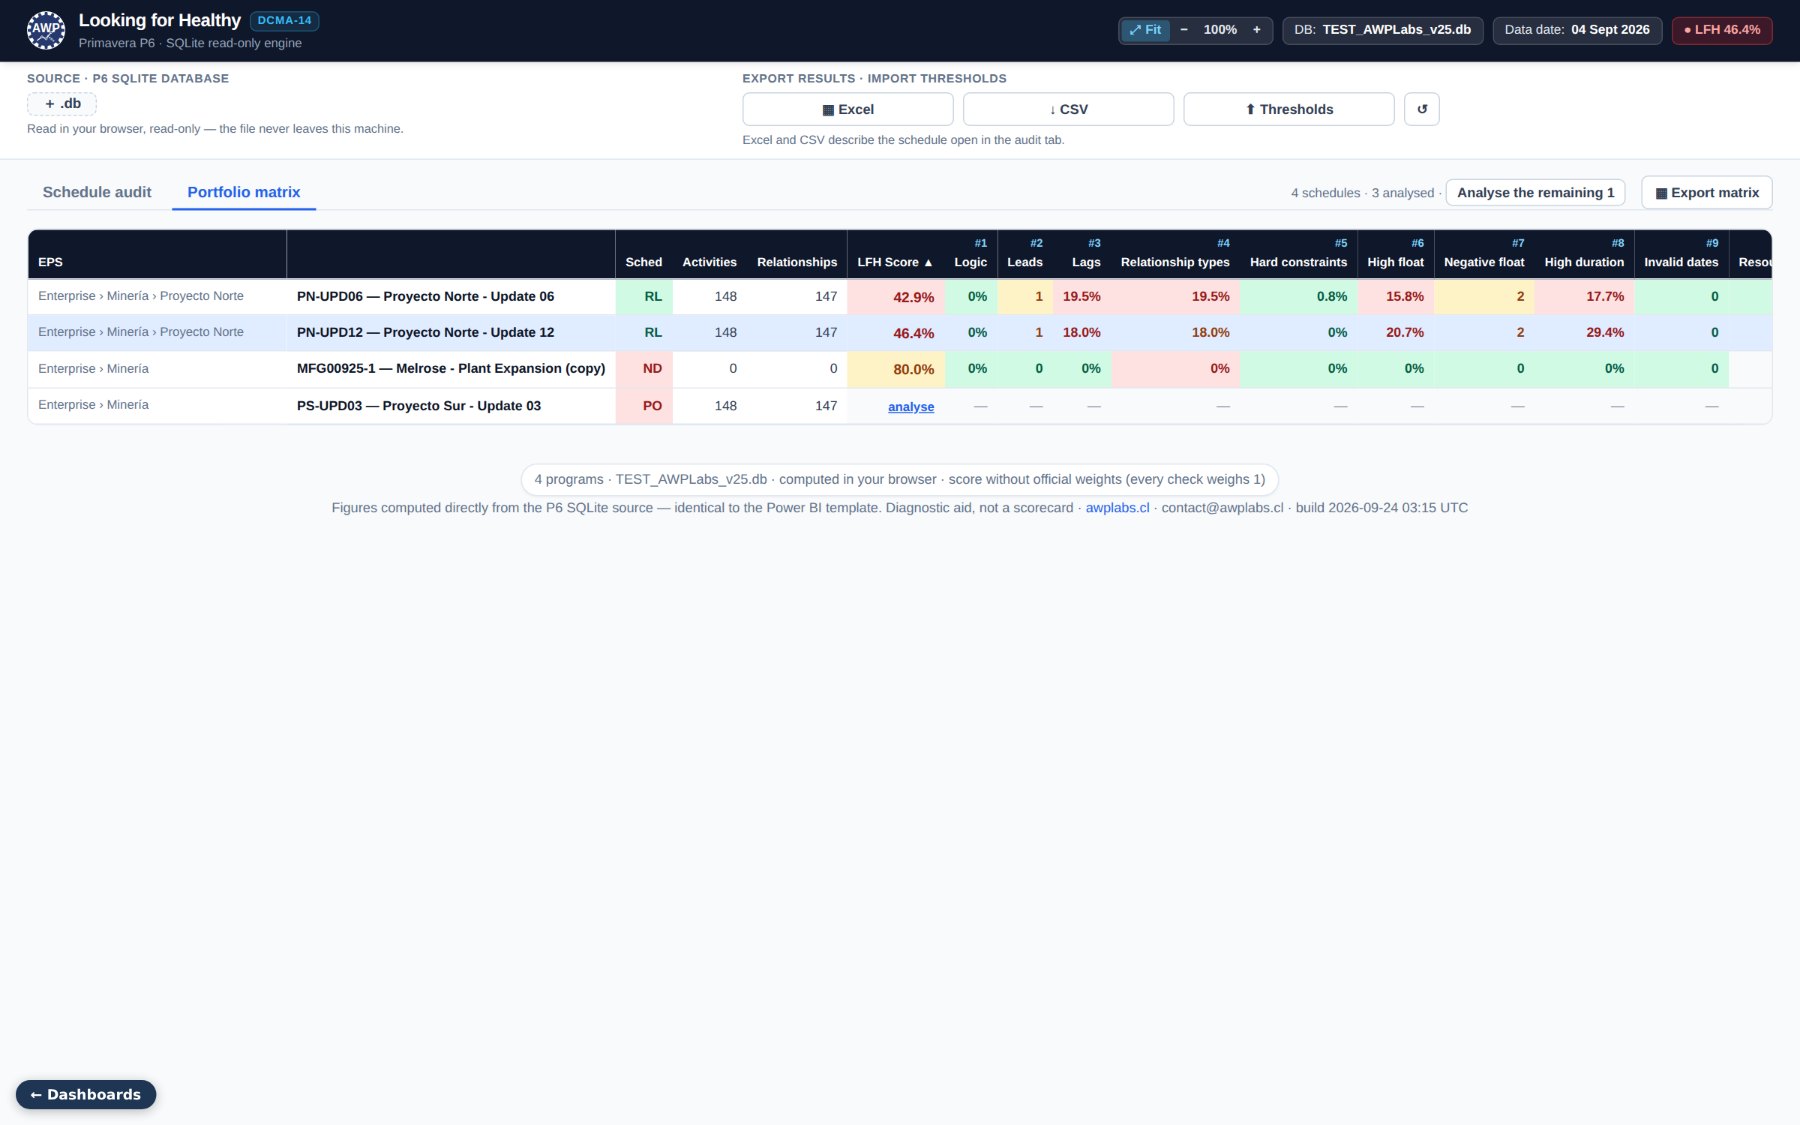 Schedules · EPS. Click a schedule and every dashboard follows it.
AWP Labs
Schedules · EPS. Click a schedule and every dashboard follows it.
AWP Labs
02
Schedule: A against B, one delta everywhere.
A referenceB compared · Δ = B − A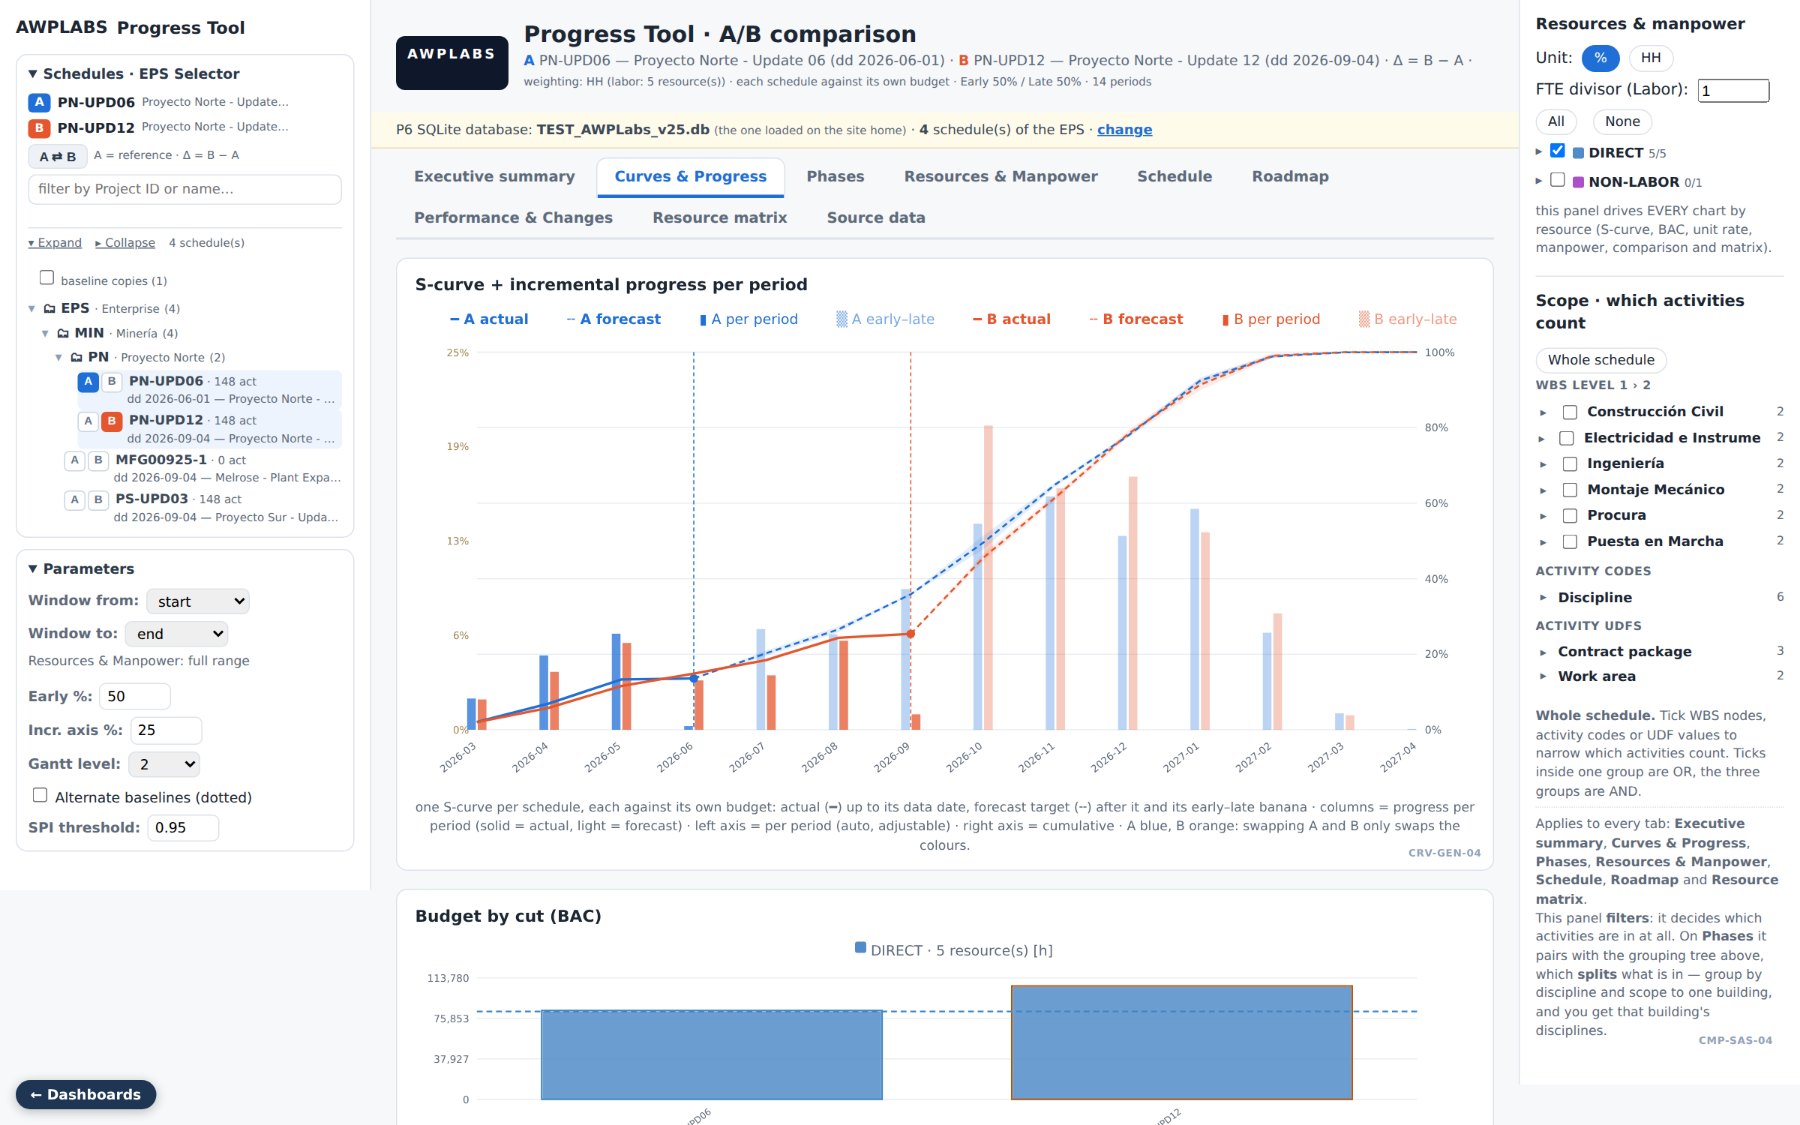 Progress Tool · Curves & Progress
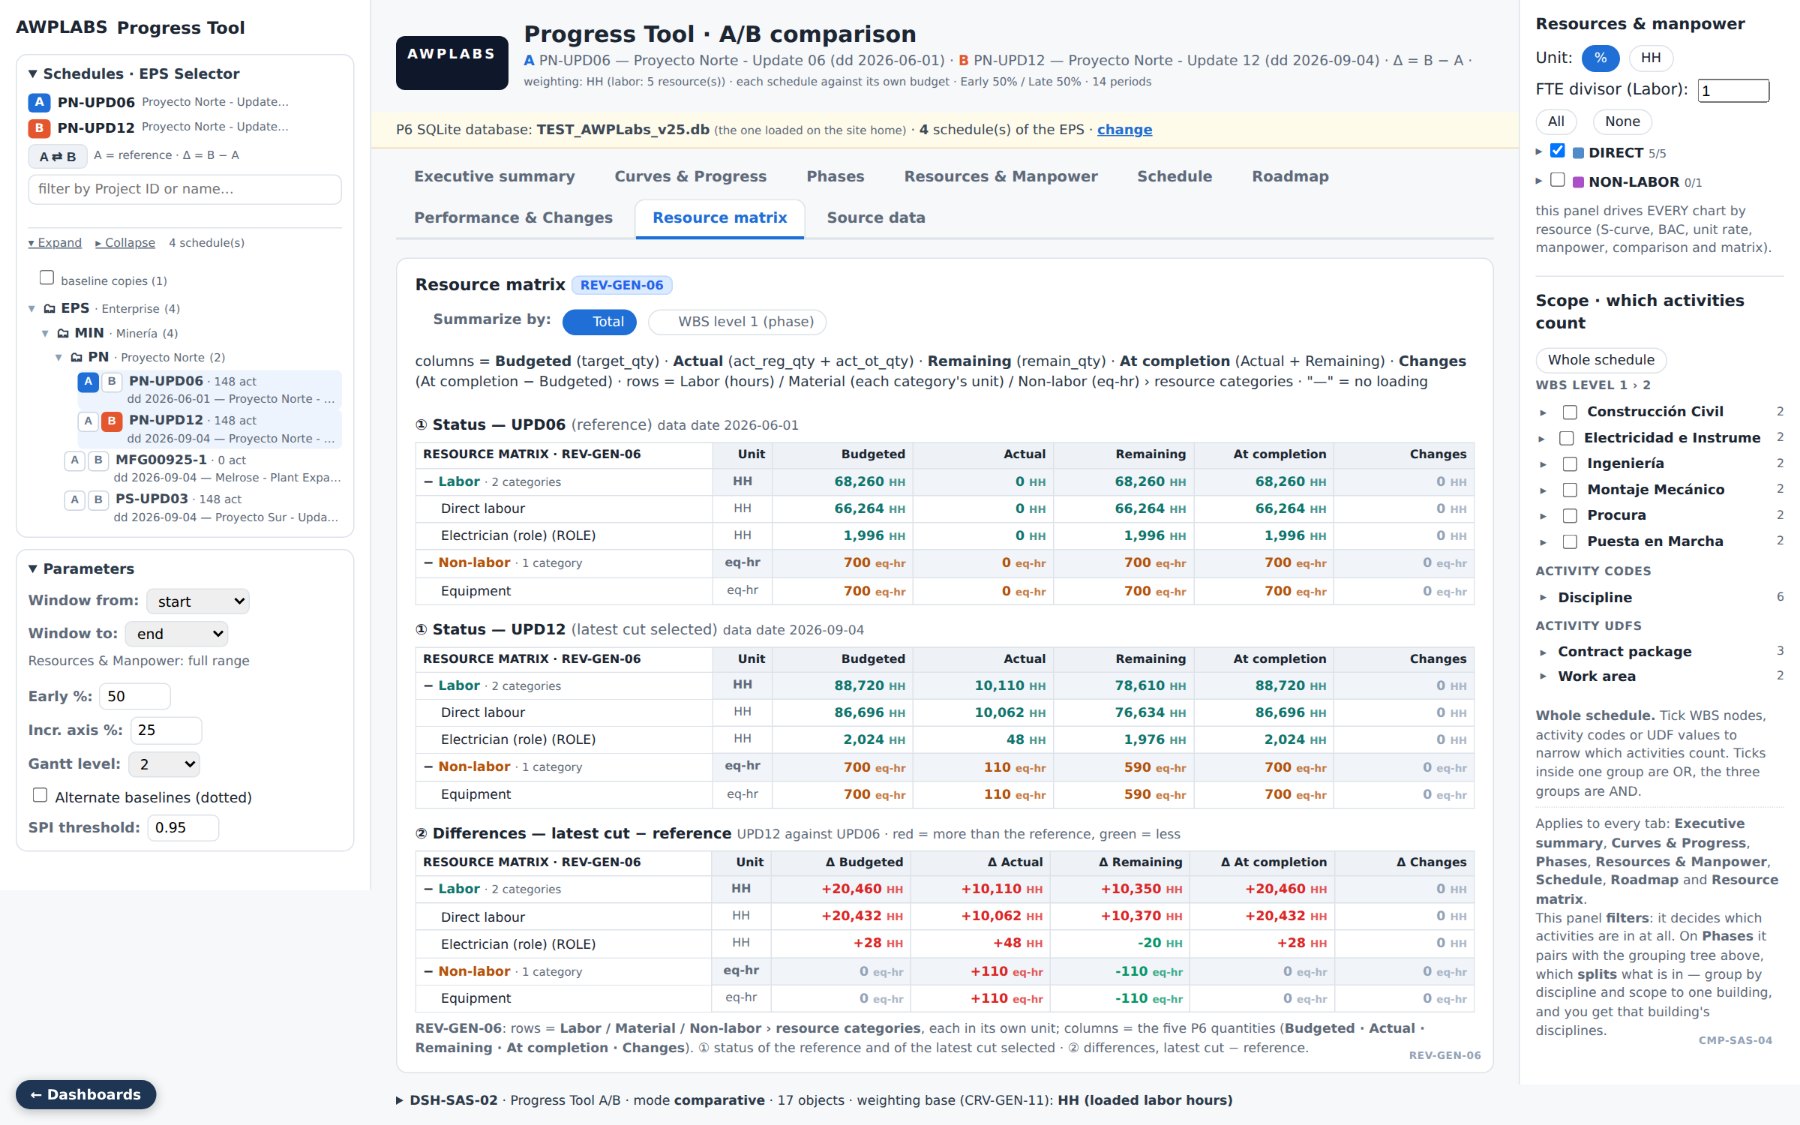 Progress Tool · Resource matrix
Two schedules, always
Baseline vs update, cut vs cut, offer vs offer. Every KPI, curve and milestone reads Δ = B − A. No N-schedule clutter.
Quantities in their own unit
Budgeted, actual, remaining and at completion straight from the assignments. Labor hours stay hours, equipment stays equipment.
Quality and logic compared too
DCMA-14 side by side, traceability between phases, circular logic, milestone drift and Monte Carlo risk on both schedules.
AWP Labs
03
Activity: why the date moved, straight from the record.
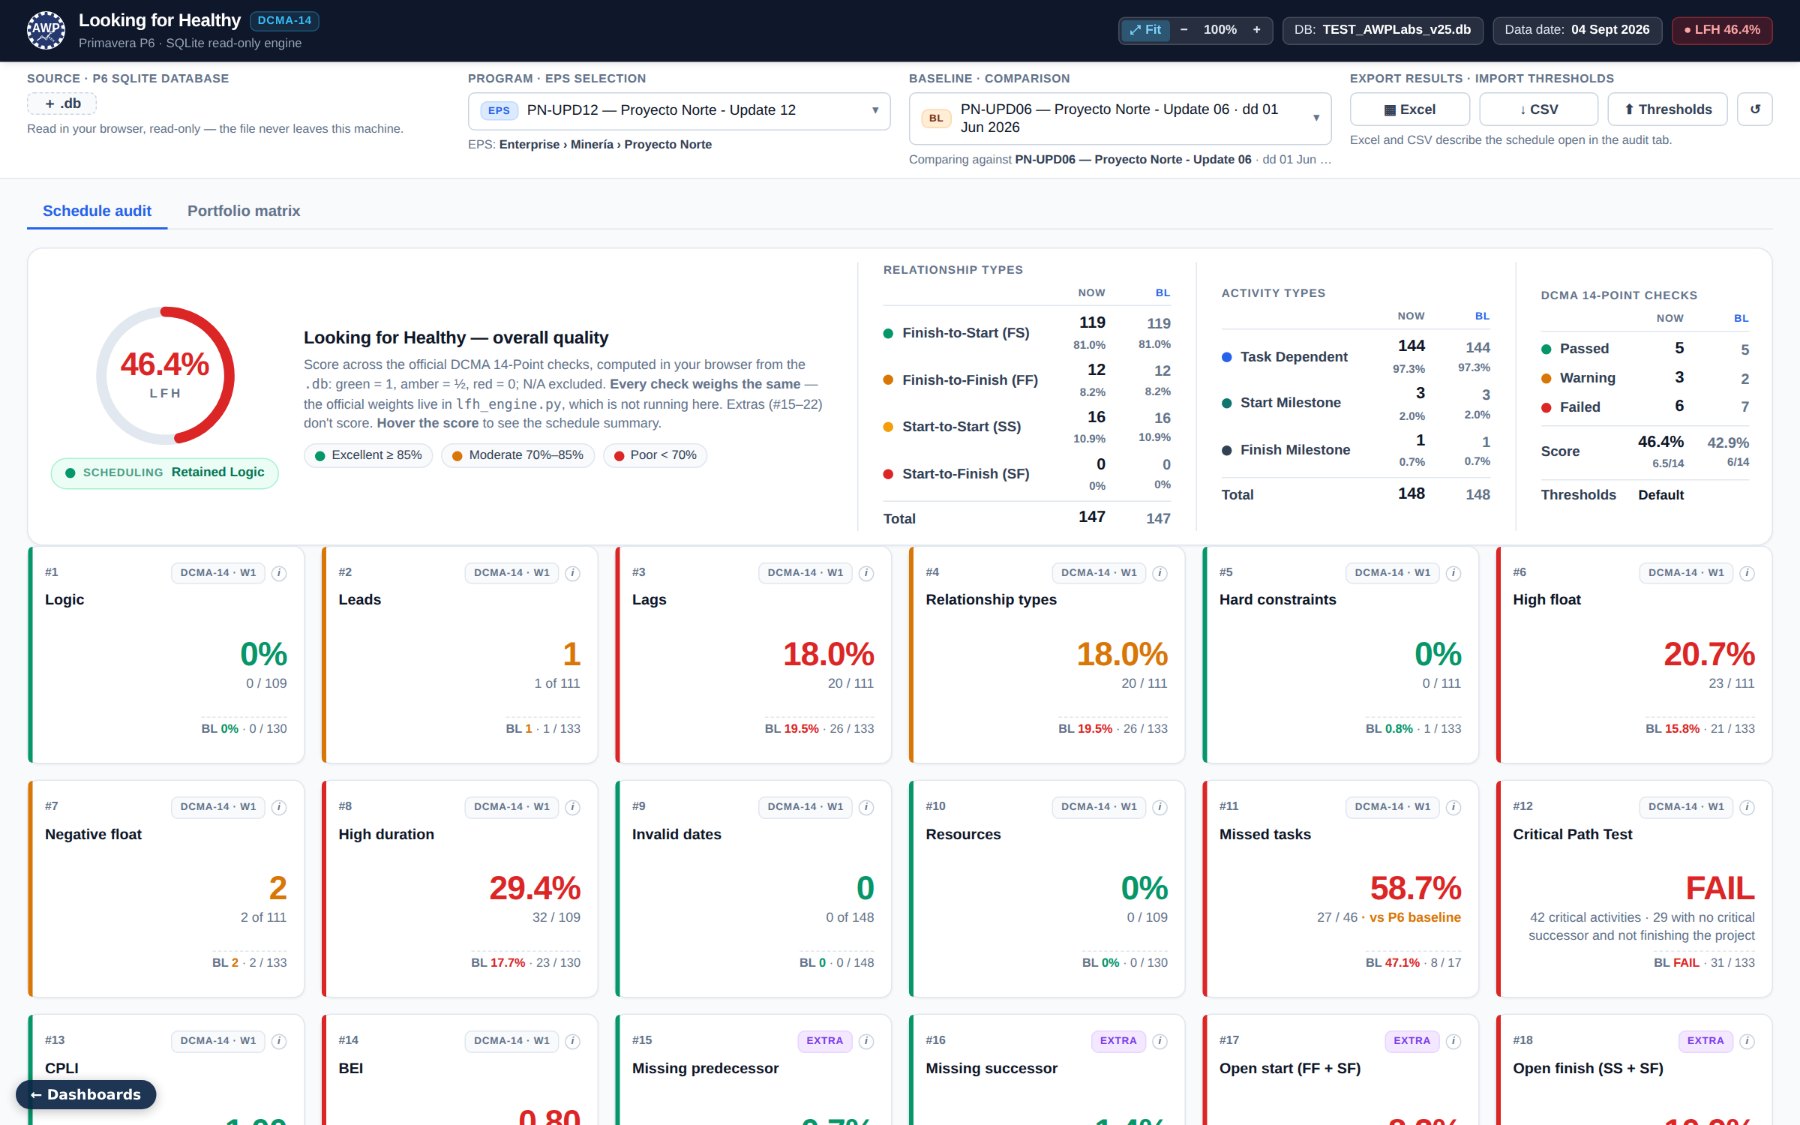
LFH · Looking for Healthy
Each DCMA-14 check shows its count over its exact denominator, now and at baseline, and lists the activities that fail it. Auditable, not a scorecard.
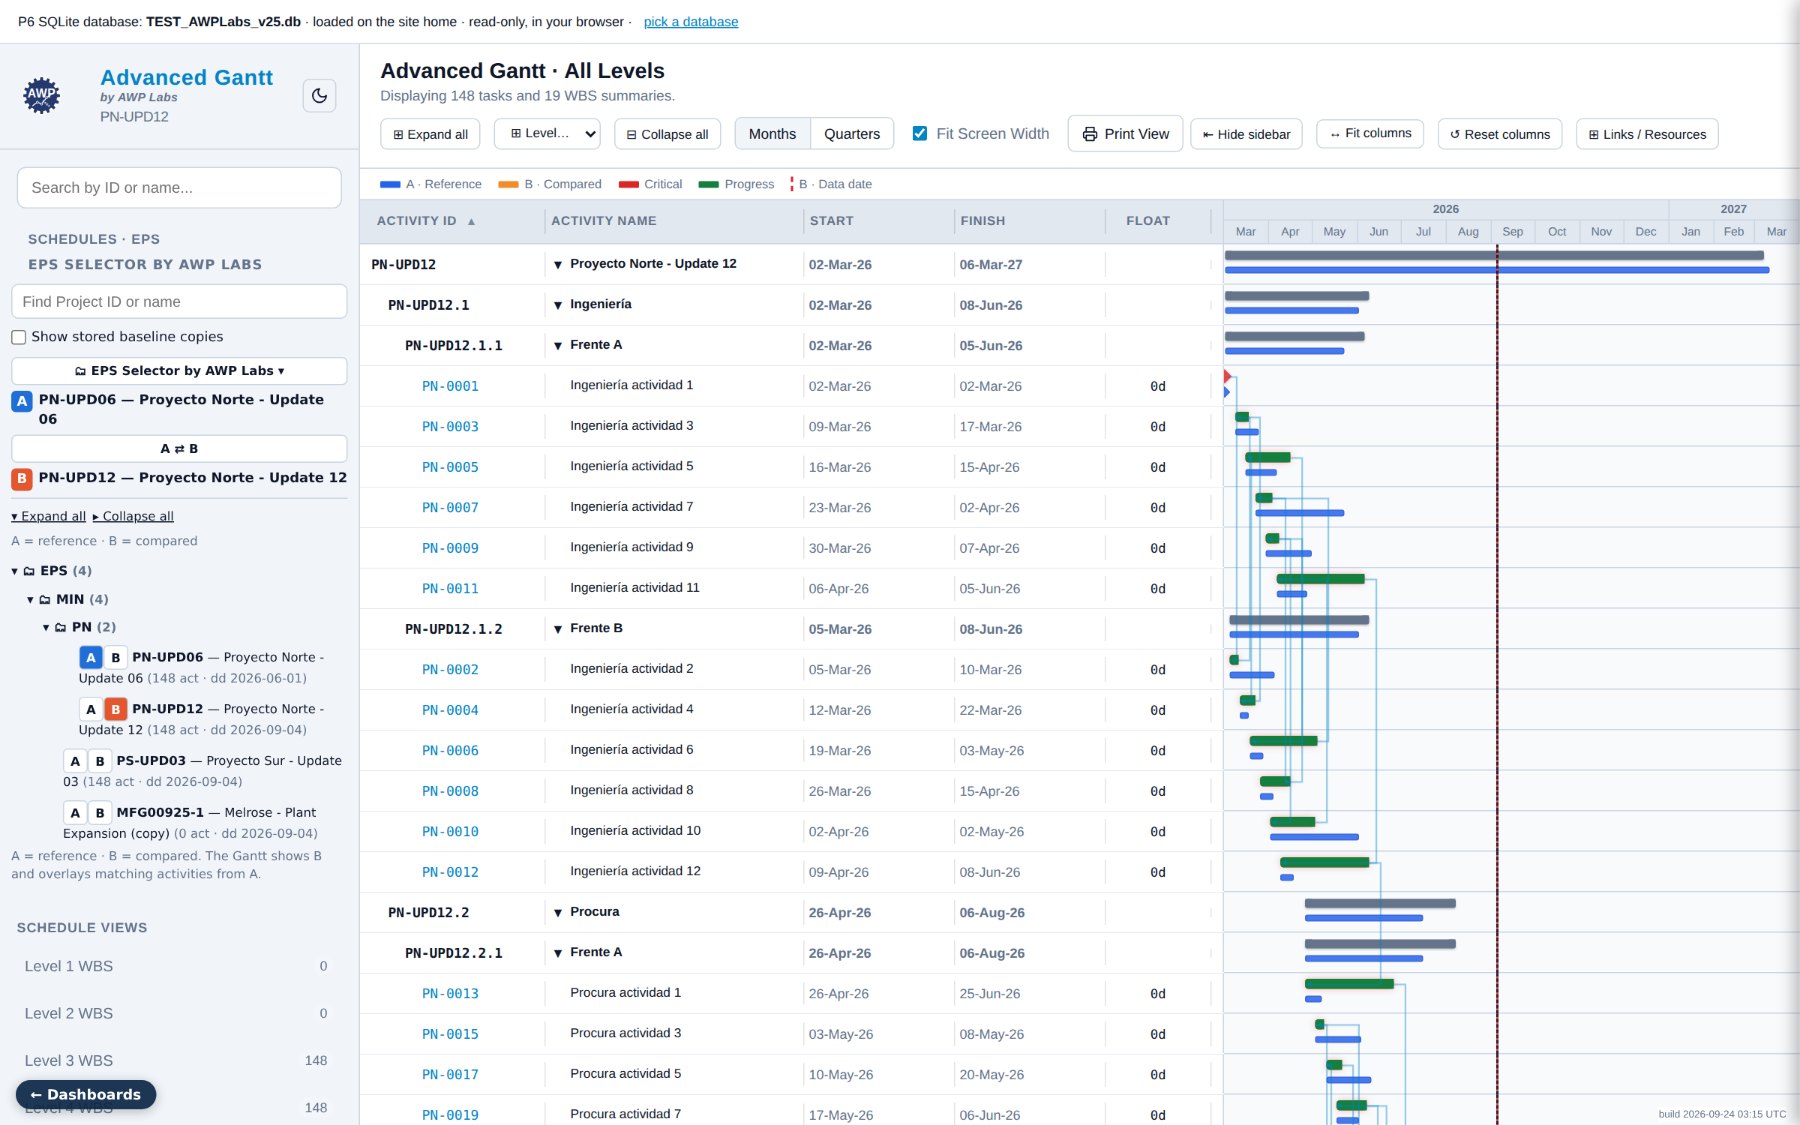
Advanced Gantt
Every activity of B with the matching bar of A underneath, its float, links and resources. Filters for critical, milestones and incomplete.
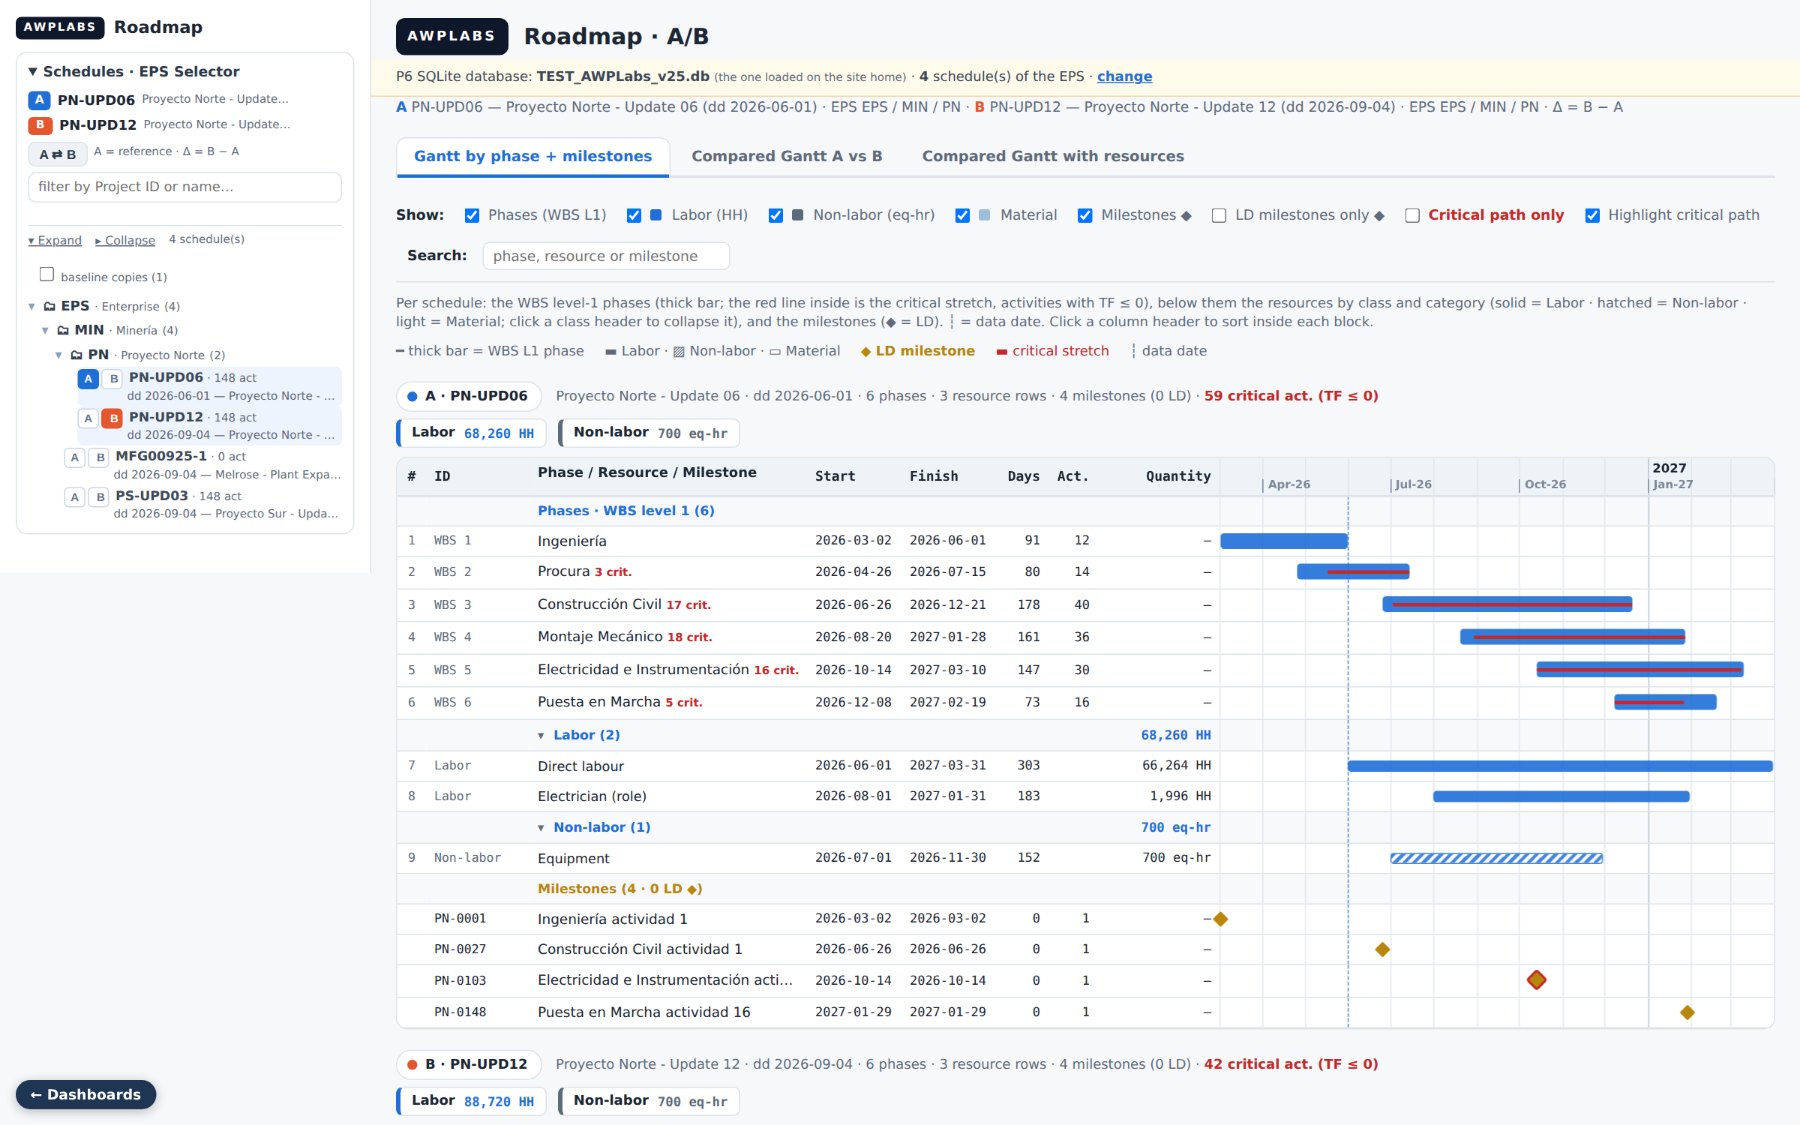
Roadmap
Phases with their critical stretch, resources by class and milestones, for A and for B, and the compared Gantt between them.
Same selector at every depth: pick A and B once on the EPS tree and every dashboard follows. Dates are read by status, so an unstarted activity never shows a false slip.
AWP Labs
Why review here
Cloud control. Saved snapshots. Data that stays with you.
SaaS, not another install
- No drivers, no desktop tools. A browser and the .db.
- One standard for owner, EPC and contractor: A vs B, one reading of every delta.
- Multi-tenant EPS in the cloud, each client's tree isolated.
- P6 stays the authoring tool. Nothing is replaced, everything is audited.
Snapshots, not a live wire
- Saved facts, not a recalculation. The same review gives the same answer months later.
- Any two: baseline vs update, cut vs cut, offer vs offer.
- One data contract, the P6 SQLite file. No XER, no intermediate exports.
- Auditable: each check keeps its exact denominator and the activities that fail it.
Your data stays on your side
- The .db opens in your browser, read-only. Nothing is uploaded.
- The dashboards run locally, disconnected from any AI and from the internet.
- Tender and NDA schedules are reviewed with no copy on any server.
- Heavy work runs on your device. The cloud keeps only the EPS, versions and cached results.
- Close the tab and no copy remains.
P6 authors. The snapshot certifies. The browser analyses. AWP Labs orders the portfolio.
How the screenshots were made. Every dashboard image on these slides was captured from the AWP Labs dashboards running on a synthetic Primavera P6 database generated for testing. No client schedule, name or figure appears anywhere in this brief.